Import layout data to Layout manager
You can use Layout manager to import layout data to your model to verify the as-built conditions.
You can copy the file that contains the layout data from a layout device, such as Trimble® LM80, to your computer and import the file later to Layout manager. You can also import the layout data from Trimble Connect to Layout manager. Alternatively, you can import a file directly to Layout manager. You can do this if you connect the layout device to your computer using a USB, or with a Bluetooth connection.
Import layout data
- If needed, check from the Settings
 that the default import settings are as intended, and modify the settings if needed.
- In Layout manager, click Import
 .
.
The import dialog has tabs for design points and measured points. Design points are layout points that have been created in the Tekla Structures model. Measured points are layout points that have been measured on the construction site.
-
Select the file to import.
Points imported from Trimble FieldLink files (.tflx) are shown in the Layout manager dialog using different colors and symbols, depending on the visual classification type of the point. In the model, the imported points are shown by the class color that most closely matches the color of the symbol.
Trimble FieldLink color Tekla Structures color Description 

Control point


Tolerance status - low


Tolerance status - in tolerance


Tolerance status - high


Design point


April tag


Plane level in tolerance


Plane level high tolerance


Plane level low tolerance


Stake in tolerance


Stake out tolerance
If a point file does not contain column headers, Layout manager opens the Text File Import - Column Headers Mapping dialog where you can define the columns.
- Click Import.
The imported points are created in the model and displayed in the Layout manager dialog in the group that you selected in the import dialog box.
Some imported points may be located outside the tolerance values that you have defined for measured points in Layout manager Settings. These points are listed in the Out of tolerance group. The tolerance deviation is determined by comparing the imported measured points to the design points that have been created in the model. The deviation data can be used to adjust the design point locations to match the measured point locations on the site.
Measured points have the suffix _MP in their original name to distinguish them from design points both in the model and in drawings. The group a point belongs to is shown in parentheses after the point name.
When you select a point in the Out of tolerance group, the properties of the point are shown in Layout manager. Check that the deviation data accurately reflects the data in the import .tflx or .tfl file. The values that are outside the defined tolerance values are shown against a red background.
If the tolerance value is displayed as
-999999999.0, it means that Layout manager could not calculate the deviation between the measured point and the design point. The reason can be that one or more of the measured points or corresponding design points are missing from the model, the measured points were not imported correctly, or that the correct import file format was not used. The out-of-tolerance values are only calculated for points that are imported from a .tflx or .tfl file.If all points are in the model, try importing the file again, and then close and re-open Layout manager.
The Tekla Structures session history log (TeklaStructures-<process ID.log) may also contain information about why the deviation could not be calculated.
To visualize the measured points in the model, use the
 Layout tolerance options:
-
Show only measured points temporarily hides all layout objects except the measured points.
-
Show only out-of-tolerance points temporarily hides all layout objects except the measured points that are out of tolerance.
-
Show all restores the visibility of all layout objects.
-
Define point file columns
You can import layout points to your model in a point file that lists the layout point names and the point coordinates. If the point file does not have a header, or if Layout manager does not recognize the header, the Text File Import - Column Headers Mapping dialog is displayed when you select the import file.
Example of a point file without a header:
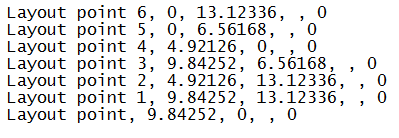
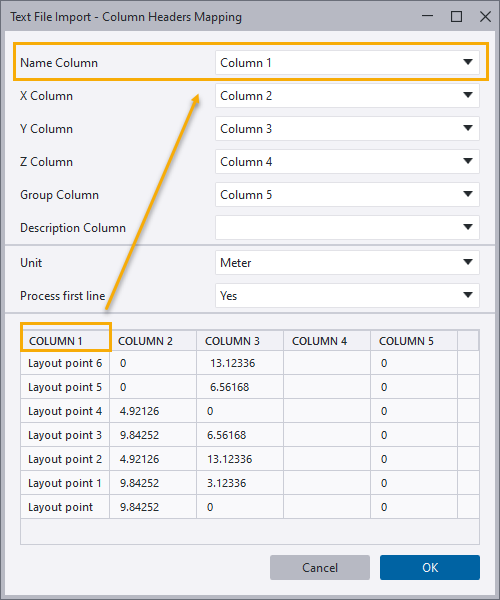
In the Text File Import - Column Headers Mapping dialog, the content of the point file is shown at the bottom and the column headings are shown at the top.
-
Check that the point file content is shown under the correct column headings:
-
Name Column shows the layout point name.
-
X Column shows the x coordinates.
-
Y Column shows the y coordinates.
-
Z Column shows the z coordinates.
-
Group column shows the group where the points are imported.
-
Measured points in Layout manager
Measured points are points that are measured on the construction site using a layout device and imported to Tekla Structures. You can view the properties of measured points in Layout manager or in the Layout point tool dialog. In addition to the general point properties, such as name, diameter, and shape, the measured points have measured point properties that cannot be modified in Tekla Structures.
To view the measured point properties, select the point in Layout manager or double-click the point in the model.
The measured point properties are as follows:
|
Property |
Description |
|---|---|
|
Is Stakeout Point |
You can label a measured point as staked in the Trimble® LM80 device if it deviates from the corresponding layout point created in the model. The property is shown in the Layout point tool dialog. |
|
Is Field Point |
A field point has been measured on the construction site and imported to Tekla Structures. Is Field Line is the corresponding property for layout lines. The property is shown in the Layout point tool dialog. |
|
HR |
Height of rod is the height of the prism on the pole. It is used to determine instrument height, and therefore the actual elevation of the measured point. |
|
HA |
Horizontal angle is the angle that was measured from the back sight, or 0 angle. |
|
VA |
Vertical angle is the difference in angle measurement from the horizontal position of the instrument scope. |
|
SD |
Slope distance is the actual distance regardless of elevation change. Horizontal angle is the distance along a horizontal plane. |
|
PPM |
Parts per million is a factor used to determine measurements that take into account the air conditions and how they affect the ability of light to travel through the air. This property is important in the measurement calculation and accuracy. |
|
Benchmark offset |
Benchmark offset is a measurement that defines a benchmark that elevation measurements are calculated from. |