New - Footfall assessment of floor vibration to SCI P354
Technological advances in structural design have made buildings lighter and more efficient. This can lead to floors being more sensitive to vibration due to walking-related activities. An assessment of this sensitivity is commonly required to avoid adverse disturbance of occupants or sensitive equipment. Previous versions of Tekla Structural Designer included options to run simplified Floor Vibration checks to either DG11 (for the US regional code) or SCI P354 (for BS/ Eurocode regional codes). While pragmatic, these simple ‘hand method’ checks could be limited in terms of geometric applicability and accuracy (they are retained in this release should you still want to make use of them). The desire for a more generally applicable and accurate method has resulted in a comprehensive new rigorous analytical Footfall Assessment being introduced in the 2023 Release.
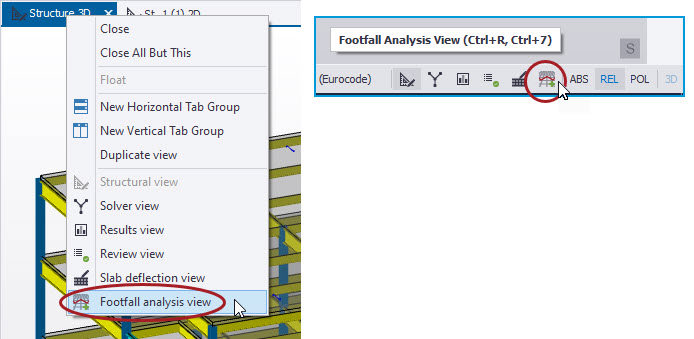
While such rigorous Footfall assessment is a complex topic and process, our Engineers have created a workflow that is simple to use while still providing all the detail to ensure the assessment is not a "black box." The assessment process is entirely self-contained within Structural Designer from the existing structural model and is carried out via a new dedicated FOOTFALL ANALYSIS view as shown in the picture below.

The intention in these notes is to provide a brief overview of the main intention, process and workflow of the feature - for more in depth details see the new Help Topic(s) Footfall assessment handbook and Footfall assessment settings and eLearning Course Footfall assessment in Tekla Structural Designer.
Method
This first release of the
Footfall Assessment implements the method of the guide SCI P354: Design of Floors
for Vibration: A New Approach by the Steel Construction Institute. While
this is a UK publication, the method follows general and universal principles of
dynamic structural behavior so could potentially be used in any region of the world
(subject to the requirements of local authorities).
-
Scope - it should be noted that the guidance in SCI P354 is almost entirely based on steel buildings with composite or precast floors. However, the Footfall Assessment process in Tekla Structural Designer can be performed on models of any material with floors of any construction type. Where the structure is not predominantly a steel building with composite or precast floors, it is the engineer’s responsibility to determine the applicability of the SCI P354 guide method, and thus the Footfall Assessment in Structural Designer which follows this, to their structure.
-
Analysis Process - for a full understanding of this, consult the SCI P354 guide. In simple terms, the rigorous analytical method involves:
-
A modal analysis of an analytical model of the floor being assessed.
-
The analytical floor model is automatically created from the main structural model. It is typically composed of the beams and slabs of a floor and the single column/ wall stacks directly above and below it.
-
To include its stiffness in the analysis, the slab is meshed with 2D elements which are orthotropic in the case of 1-way spanning slabs. The supporting beams are subdivided into 1D elements connected to the slab 2D element mesh to produce a well discretized analysis model of both beams and slabs.
-
The solver model can be reviewed in the Solver view, just as for other analysis types, and the resulting mode shapes can be viewed in the usual manner.
-
-
The results of the modal analysis - the mode shapes and their modal properties - are then subject to a fully automated post-analysis process to calculate the response (SRSS) accelerations likely to result from excitation of the floor by walking occupants. The walking excitation is defined in terms of a Footfall (pacing) frequency and a number of other parameters such as the walker’s weight, length of stride and walking path. Acceleration values are calculated at every node of the slab 2D element mesh.
-
The response to excitation can be either Resonant, for lower frequencies, or Transient for higher frequencies, different methods of calculating the response acceleration being applicable to each. Floors are broadly classified as either Low or High frequency by their first (lowest) frequency; Low being 0 to 10 Hz and High > 8Hz.
-
The industry recommendation is to calculate both response types when the floor is nominally classed as Low frequency. Hence both Resonant and Transient response accelerations can be automatically calculated from the modal analysis results for all exciting (pacing) frequencies.
-
-
-
From the response accelerations a Response Factor (Rf) - which is a measure of human perception of acceleration - is then calculated and compared to a Target value. The SCI guide defines acceptable Target Rf values for different building uses and circumstances, e.g a workshop or residential building during day time etc.
-
A number of events (per period) is also calculated at each node for a Target Vibration Dose (VDV) assessment. See below for more about this.
-
Footfall Assessment Settings
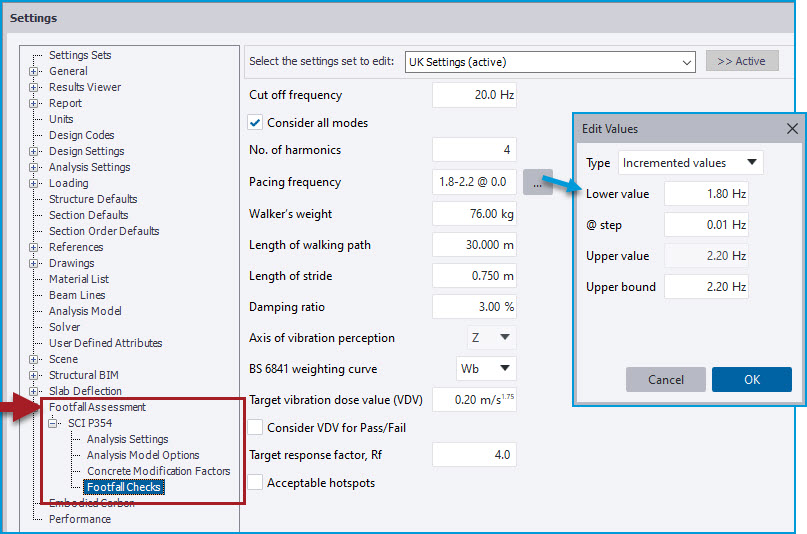
A new set of Footfall Assessment settings is added to Global Settings as
shown in the picture below. These set the initial Footfall Assessment options and
parameters for new models. Briefly the Settings are:
-
Analysis Settings - these all relate to Modal Analysis and are essentially the same as those for running Modal Analysis directly.
-
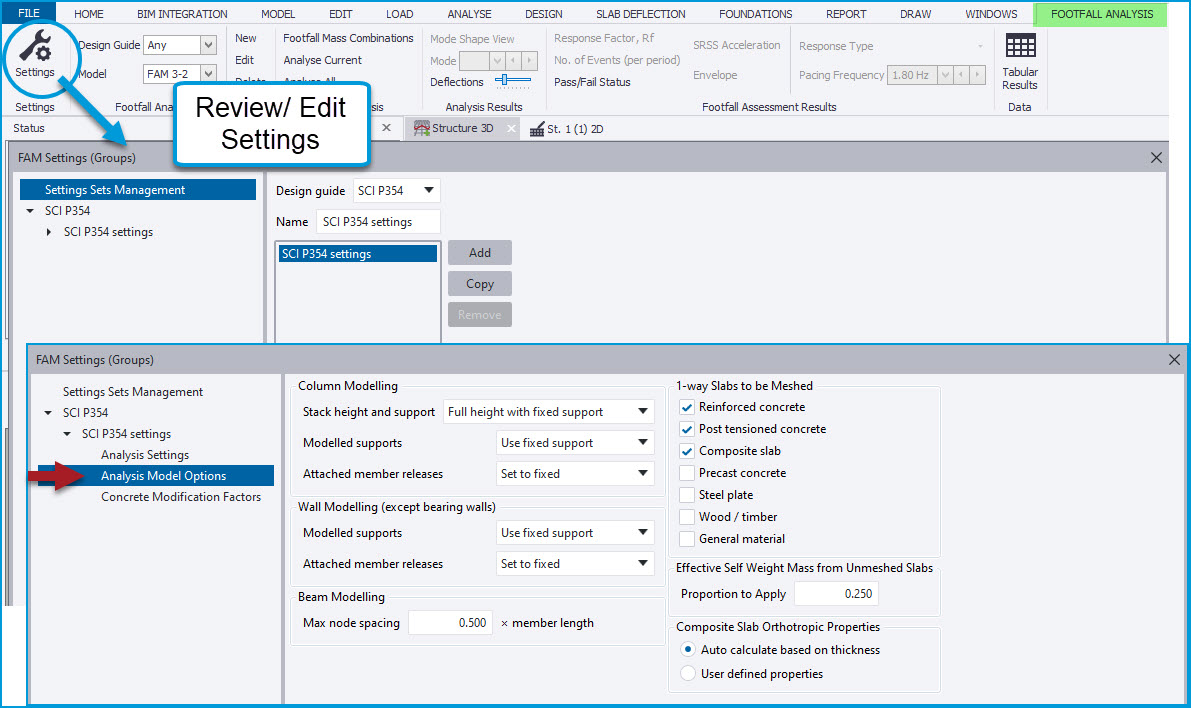
Analysis Model Options - these settings control the automatic creation of the Floor Analysis Model (FAM) discussed above. For example, amongst others, there are options to control whether columns stacks above/ below the floor level are modeled as full or half height and with fixed or pinned supports.
-
Concrete Modification Factors - these are modification factors specific to the Footfall assessment modal analysis for concrete entities (default for all = 1.0)
-
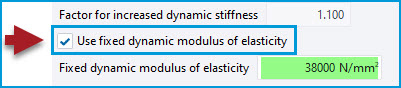
Note the option on this page below the modification factors table to use a fixed modulus of elasticity (E) value as suggested by the SCI guide - when this option is enabled you can specify the value to be used for all concrete entities regardless of their concrete grade (which will otherwise determine their E value)
-
-
Footfall Checks - these set the initial values for each FAM model created of the various parameters used to calculate and check the Response accelerations, Rf’s and Number of Events (per period). Note in particular the Pacing Frequency, which can be defined as either a number of specific discrete values, or a range of values between an upper and lower bound with a defined step increment - e.g. by default a range from 1.80 Hz to 2.2 Hz in increments of 0.01 Hz.
Workflow
Footfall Analysis
View - to begin the process, you can open the Footfall analysis view, either
from the view tab right-click context menu or a dedicated Status Bar button at the
bottom right of the program window.
-
Note that this option is only available for the 3D Structure view.
-
In this view, via “Settings” you can access the Footfall Assessment settings specific to the project file. You can create a number of different settings sets to use if you wish. For each set you can review and edit for example the Analysis Model Options prior to creating a model, as shown in the picture below. These can also be subsequently edited to change them for existing models.
Creating & working with Footfall Analysis Models - the process begins by creating a Footfall analysis model (FAM) for a floor on the basis of the entities it contains. The creation method is extremely simple and rapid:
-
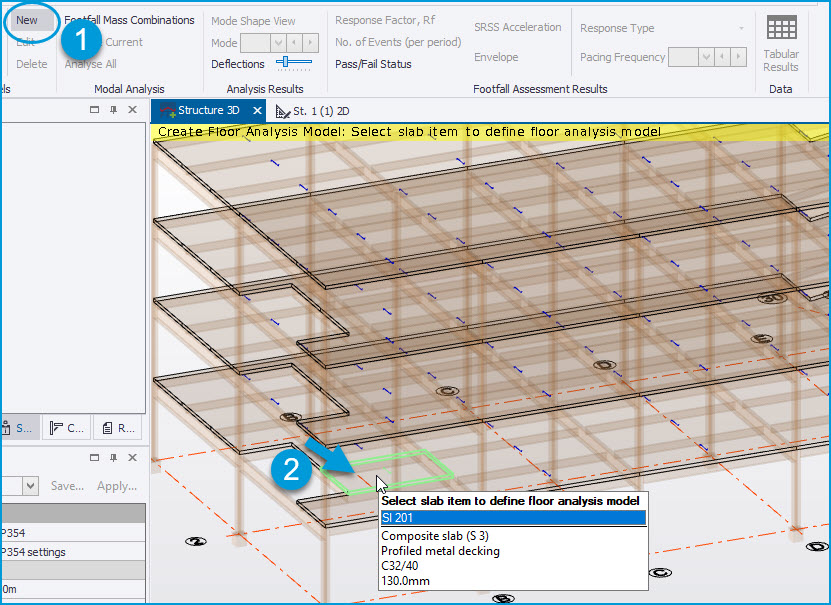
The process begins* by 1) selecting “New” on the Footfall Analysis Ribbon, then 2) selecting any slab item in the model in the floor you wish to assess - on doing so a dedicated FAM view opens in which only entities in and directly above/ below the level are visible. Entities currently in the FAM are solid coloured while those that are displayed in the transparent ‘Ghosted’ manner.
-
*You can also right-click any slab item in any view and select “Create Floor Analysis Model” from the context menu to begin the process.
-
-
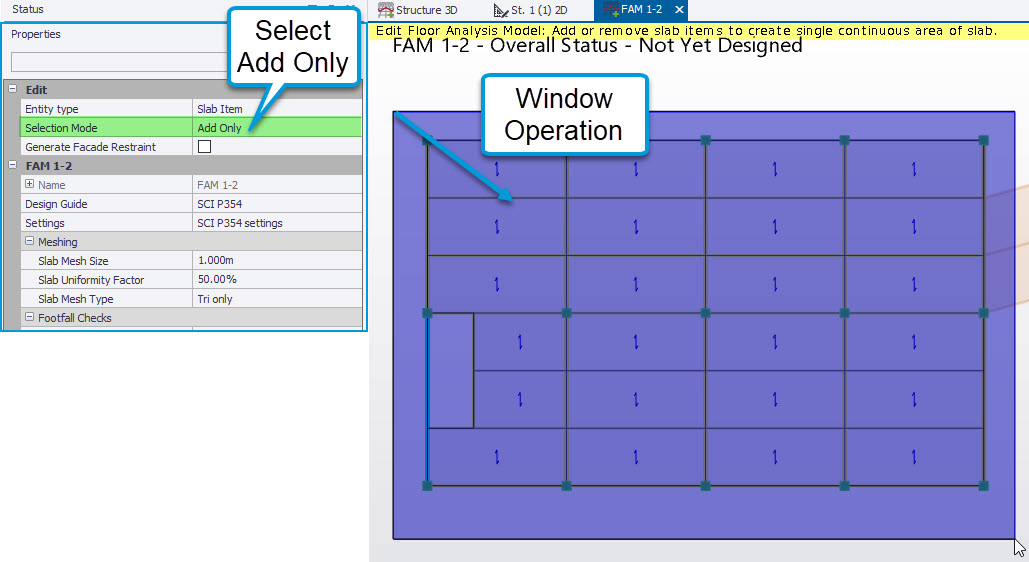
During this process, the Properties Window displays the properties of the New FAM which are initialized by the Global settings for Footfall Assessment > Footfall checks discussed above. The FAM will have a default name based on the level it is in and the number of models created on that level such as “FAM-1-1”, which you can then change if you wish in the Properties. The “Edit” group of Properties also lists the entity type you are working with - either Slab (by default) or Member Span/ Stack - and the Selection Mode.
-
You then continue to select further slabs to define the continuous slab area you wish to assess on the level - all beams and column/ wall stacks touching the slabs are automatically included. This is most easily accomplished by setting the Selection mode = “Add only” and performing a window operation to select the remaining slabs and members, as illustrated in the picture below.
-
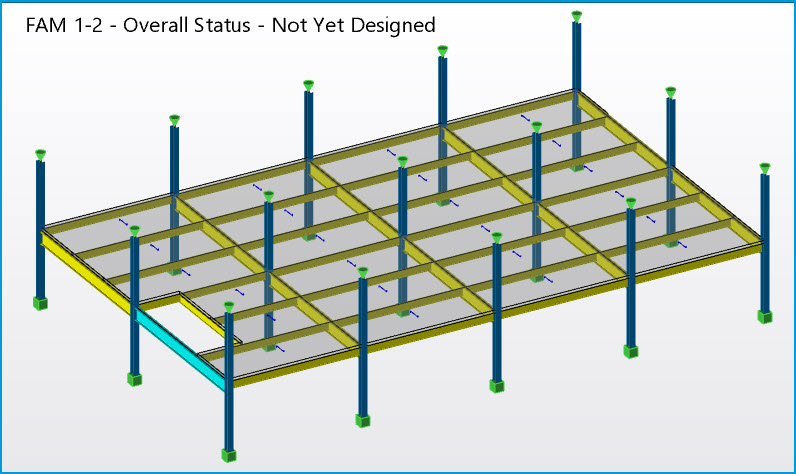
Escape from the operation to complete the FAM creation process - you will then see a Structural View of the full Footfall Analysis model you have defined. While in this dedicated view, you can activate the ribbon “Edit” command should you wish to add or remove entities from the model.
-
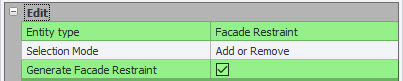
When Edit is enabled you can also enable the “Generate Facade Restraint” option shown in the picture below. This vertically restrains the nodes along slab edges (and hence those of beams along the same edge). When enabled, the restraint is automatically applied to all the slab item edges around the perimeter of the slab area and indicated by an orange continuous support icon (similar to that shown for wall supports) along these.
-
To edit where this restraint applies, set Entity type = “Facade Restraint” - you can then select individual slab edges to add or remove the restraint setting.
-
-
-
You can continue to define as many FAM’s as you wish in a similar manner, on the same or other levels. Slab items can be in more than one FAM. For example you might create a single FAM for a very large floor area which will expose areas of interest which might then be investigated with other more localized FAMs.
-
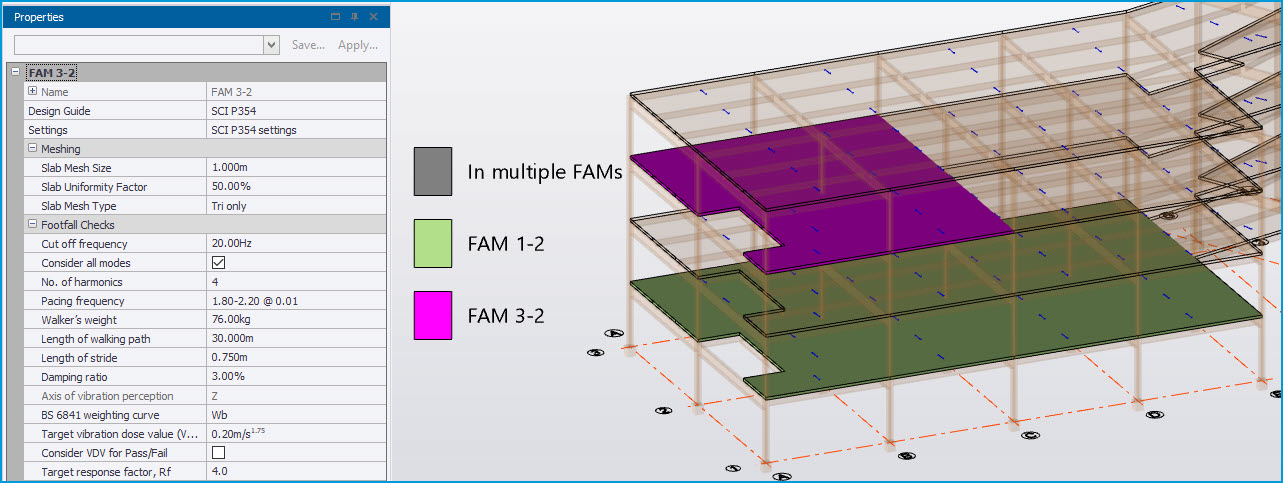
In the Structure 3D > Footfall Analysis view, the extent of the FAM(s) is shown by a shaded slab area , with a color coded legend when there is more than one FAM. In this case, one FAM is always selected - indicated by the selection color - with its properties displayed in the Properties Window, as shown in the picture below. You can then select any other FAM by clicking any part of its area to see its properties and work with it.
-
Note the “Settings” option in the FAM Properties window - where you have multiple Footfall Analysis Settings sets, this is used to select the set that applies to the FAM.
-
Mass Combinations & Modal Analysis - the next stage is to define the mass combination for the Modal Analysis, then run the Footfall Analysis.
-
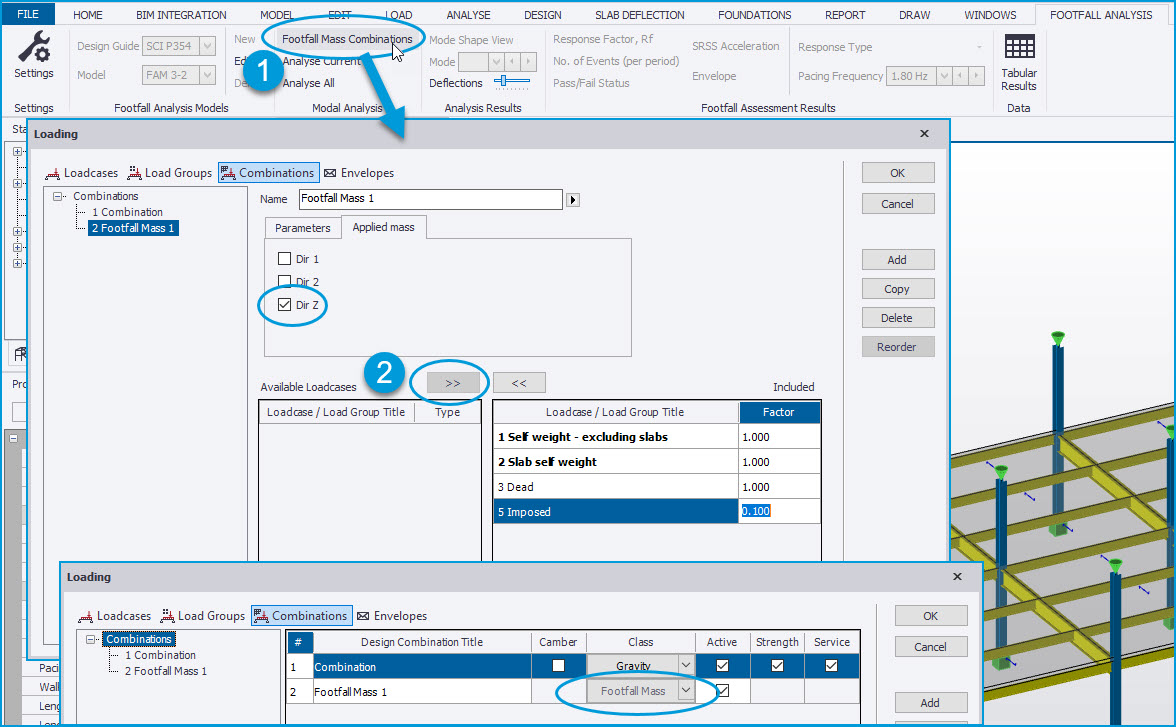
Clicking the “Footfall Mass Combinations'' button opens the Loading dialog at Combinations and adds a default combination of the new “Footfall Mass” type. You then add Loadcases to this combination (all static loadcases will be listed in the “Available Loadcases'' box) and set their factors in the usual manner. You can add further combinations of “Footfall Mass” type if you wish to consider different amounts and/ or distributions of mass.
-
In the same manner as for Seismic Inertia combinations for Seismic Analysis, and Modal Mass combinations for Modal Analysis, the Footfall Mass combination defines the mass that is typically present during the period of building use you are assessing. Hence the factors are not ‘safety’ factors - they are the proportion of the load typically present. Thus a value of 1.0 is common for Dead loadcases and some reduced factor for Imposed - SCI P354 suggests 10% for imposed, as illustrated below.
-
Note also the Applied Mass direction settings - only Dir Z (vertical) mass is enabled by default, since for Floor Vibration we are commonly interested only in vertical modes in which parts of the floor ‘bounce’ up and down.
-
-
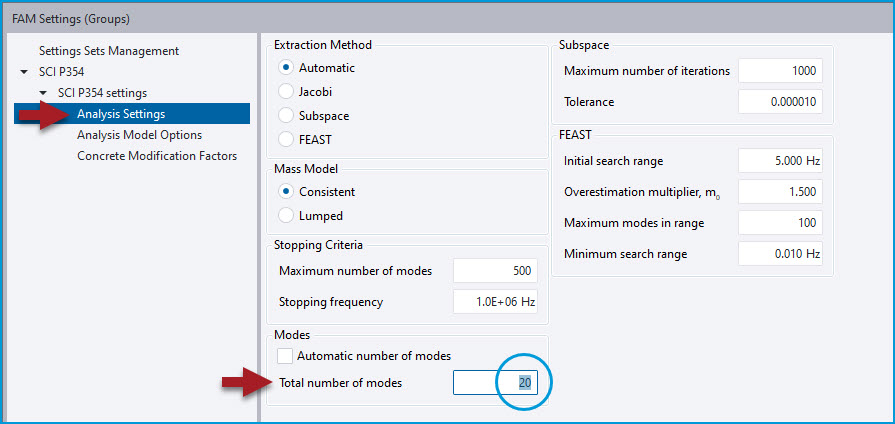
At this stage you can also review the Footfall Analysis Settings - in most cases it will not be necessary to change any of these, other than potentially the Total number of modes requested.
-
Note that sufficient modes are required to attain the “Cut off frequency” set in the FAM parameters (typically 20 Hz). With the default number of 100 it will be extremely unlikely modes above this target are not found. However for larger area models it may start to take several minutes to find 100 modes. Hence if analysis speed is felt to be an issue you can consider reducing the target number of modes.
-
For small/normal sized FAMs speed will not be an issue and there is no need to make any adjustments.
-
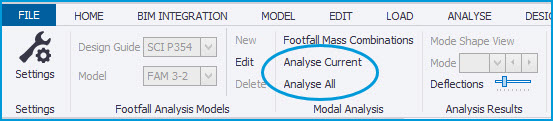
Running Analysis - next select either Analyze Current to run Footfall Analysis for the currently viewed FAM, or Analyze All to run it for all FAM’s.
-
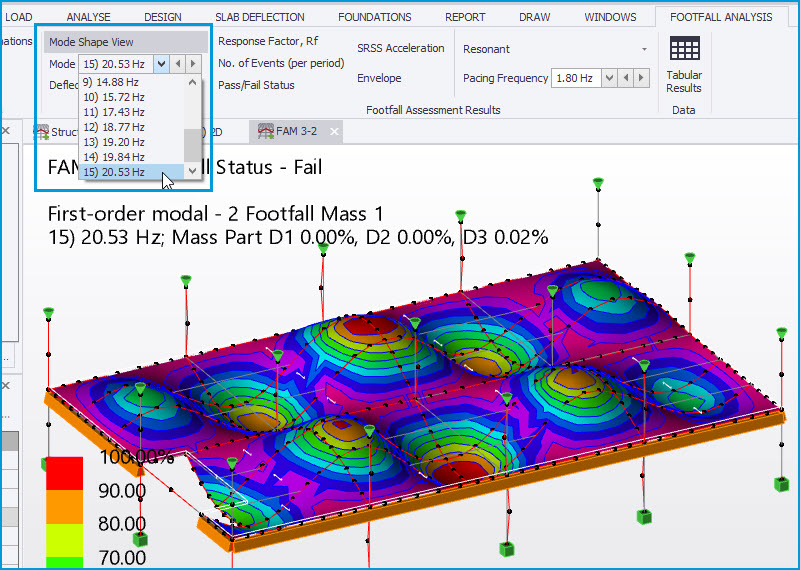
When the analysis is complete, you can activate the “Mode Shape View” button on the Footfall Analysis ribbon and select the Footfall Mass combination in the combinations list to view the resulting mode shapes. There is a drop list of all the mode shapes on the ribbon and also forward ▶ and back ◀ buttons to easily cycle through the modes. These can also be animated in the usual manner from the view right-click context menu.
Reviewing Footfall Assessment Results - when the Modal Analysis is complete and results for this are available, the automatic post-process to calculate the response accelerations and all the other results deriving from these is carried out.
-
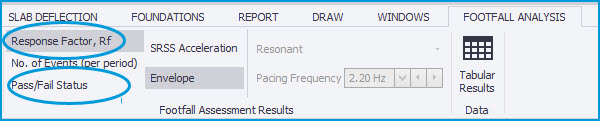
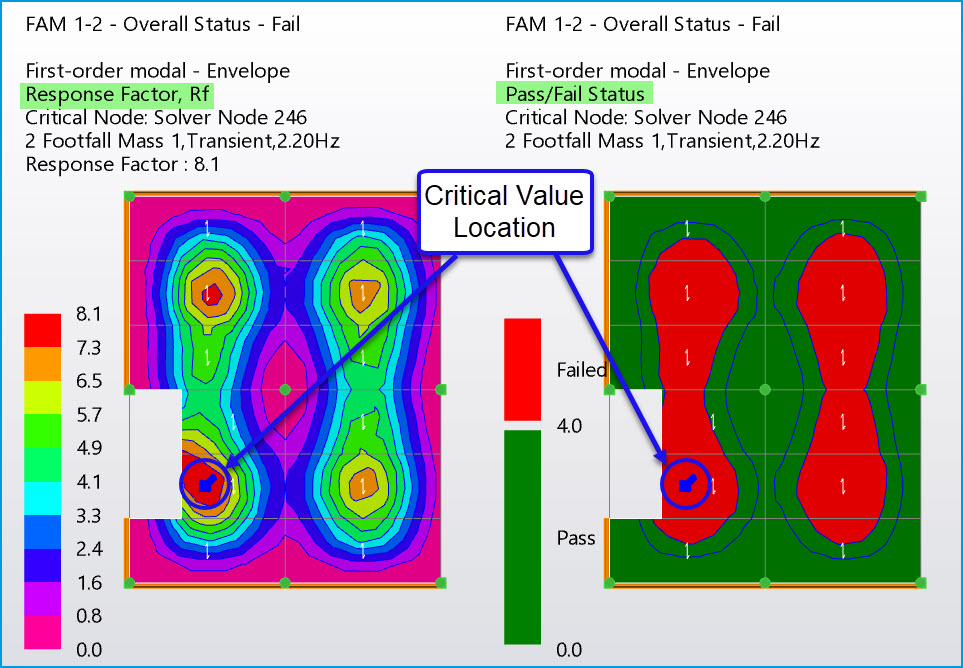
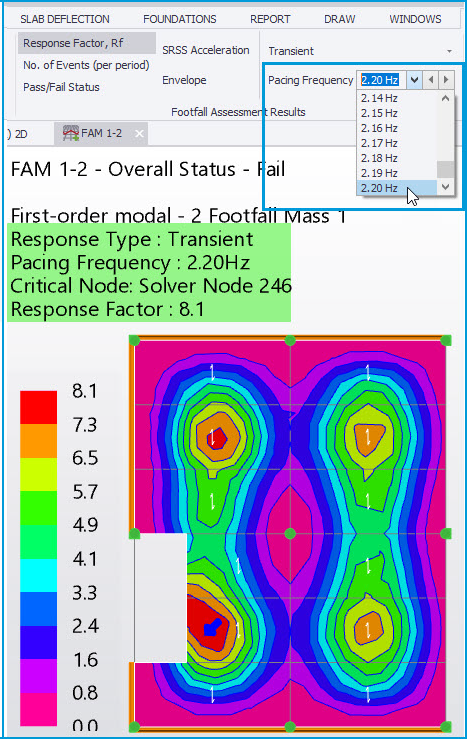
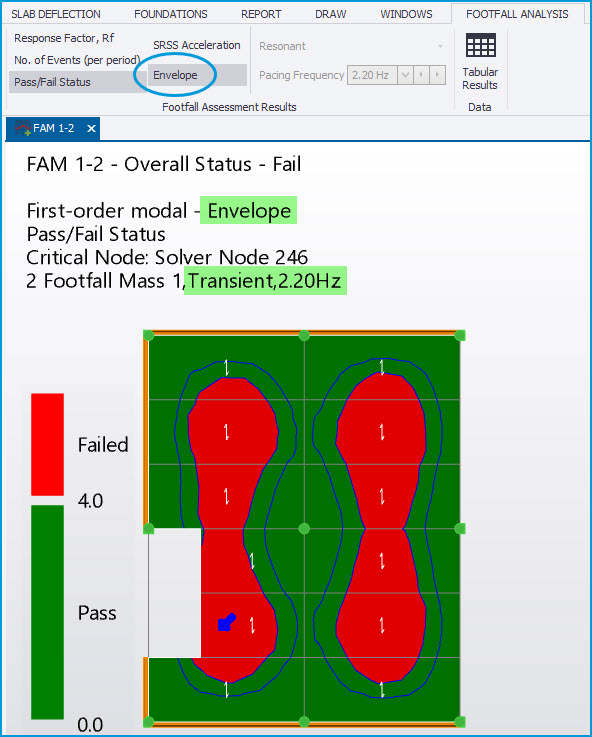
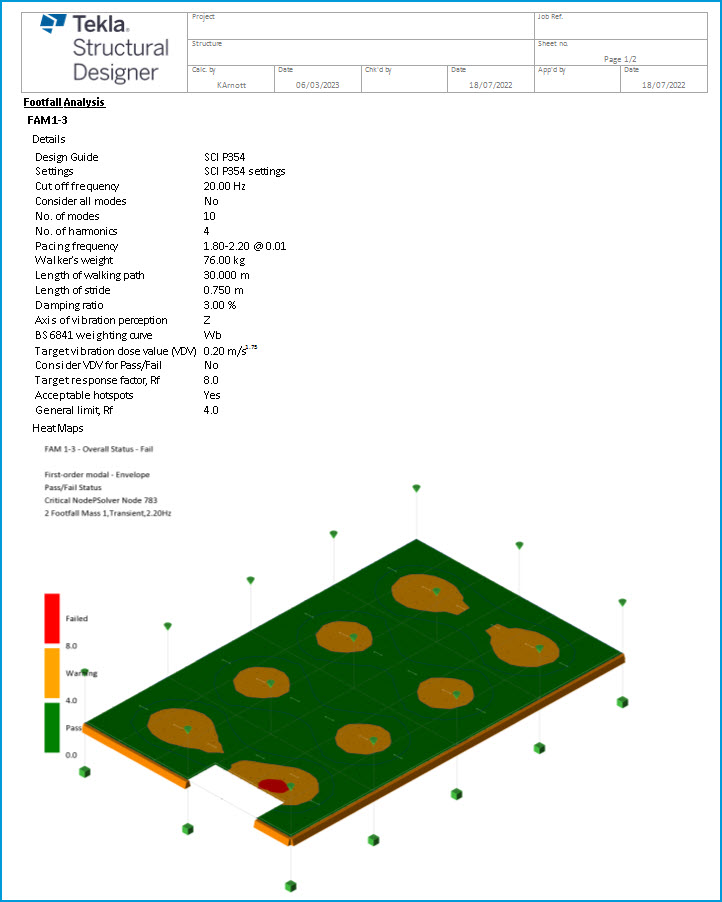
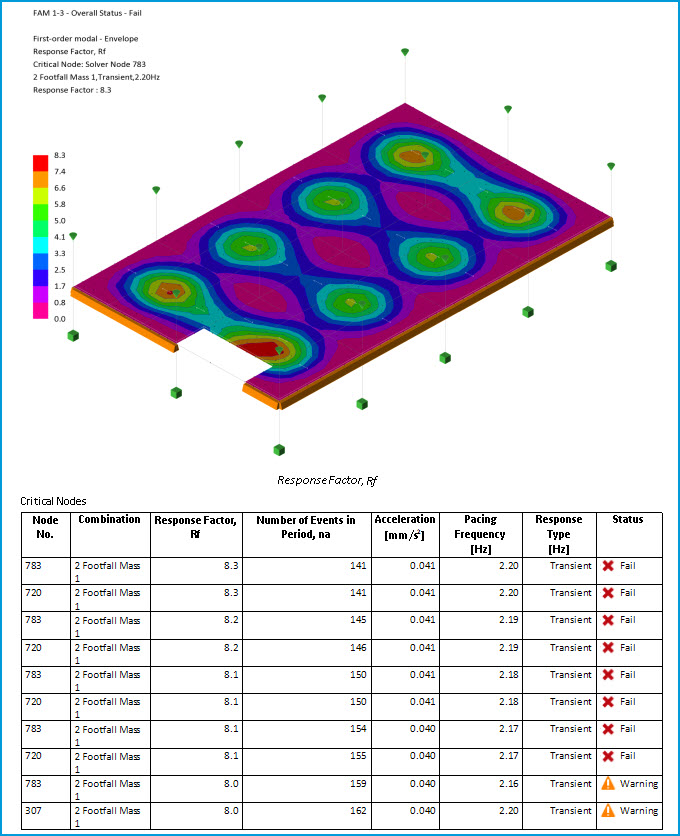
Response Factor & Pass/ Fail Status - the Response values - calculated at every node of the FAM 2D element mesh - are plotted on the FAM slab area in color-coded contours (in the same manner as 2D element force and stress results) with an associated legend. This produces ‘heat maps’ of the vibration response that can be visually assessed to understand its distribution and the location of ‘hotspots’ of peak values. The primary results to view initially via their Ribbon option buttons are the Envelope (see below for more on this) heat maps for Response Factor, Rf and Pass/ Fail Status as shown in the picture below. The location of the node with the highest/ critical response value is automatically identified with a blue location arrow as shown. The critical node, Response type, pacing frequency and Rf value are also listed in the view results text above the heat map diagram.
-
For the Pass/ Fail Status, all the calculated Rf values are checked against the “Target Response Factor, Rf” value specified in the FAM Footfall checks - a Fail status is applied for all points where the calculated Rf value exceeds this, with the highest Rf value governing the Overall Pass/ Fail status assigned to the FAM.
-
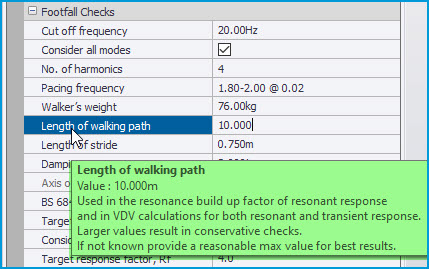
At this stage, you can make changes to any of the FAM “Footfall Checks” options and values and see these immediately reflected in the Footfall Assessment Result. Thus you can easily and rapidly experiment with the input and conduct a sensitivity analysis. There are useful tooltips for some of the parameters, such as for the “Length of walking path” as shown below, giving you an idea of what aspects of the checks they impact.
-
If you change any Footfall Analysis Model options - such as the options for fixity of connections or supports in this - or Modal Mass combination cases or factors, it is necessary to re-run the complete Footfall Analysis using Analyze Current/ All.
If any changes are made to the main 3D model geometry - such as adding or removing slabs or beams or changing section sizes etc., all FAMs affected by these changes will be updated automatically. You should then re-run the complete Footfall Analysis using Analyze Current/ All.
-
-
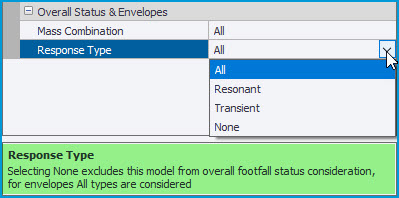
By default, both the Resonant and Transient responses discussed above are calculated and used in the checks. This is controlled by the FAM Overall Status & Envelopes > “Response Type” setting as shown above right - which defaults = All. You can set FAM checks to use only Resonant or Transient results, or to None - the information text for this setting explains the behavior of this latter option.
-
-
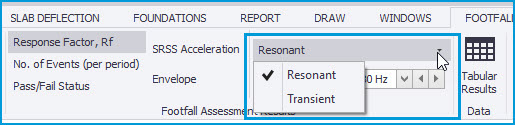
Envelope Results - By default, results are available for each Pacing Frequency for both Resonant and Transient results (when the above Response type = All setting is made for the FAM). The Footfall Assessment Results group of the ribbon has drop down options to select the specific Response Type and Pacing Frequency you wish to view results for, as shown in the pictures below.
-
The design requirement is to meet the Target Response criteria specified in the FAM Footfall Checks for all the Response Types set for the FAM and all pacing frequencies. This can rapidly and easily be checked by activating the “Envelope” option in the Footfall Assessment Results group of the ribbon, as shown below. The critical Response Type, pacing frequency and associated Rf value/ Pass/ Fail status are then automatically identified and both displayed graphically and listed in the view results text.
-
-
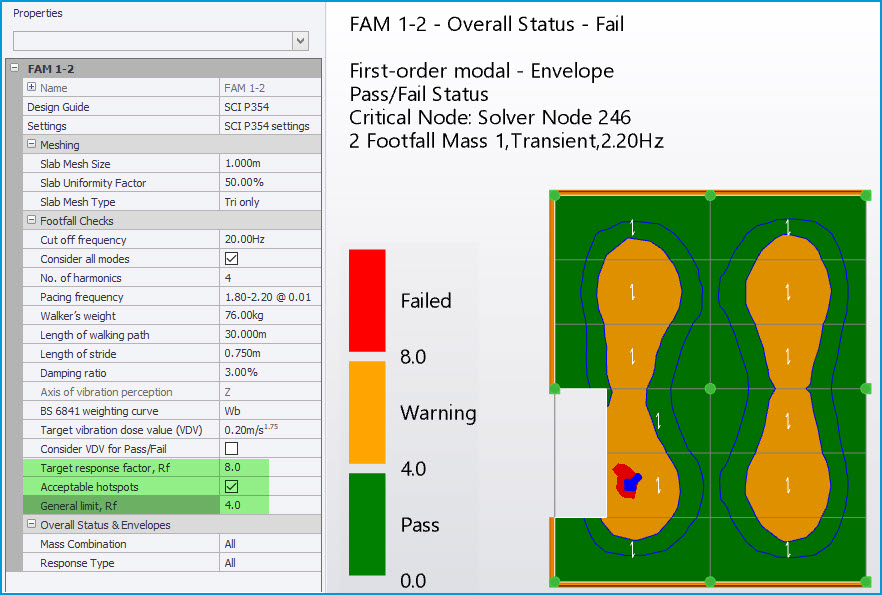
Acceptable hotspots - for the Response Factor governed Pass/ Fail status, you can optionally enable the Footfall Checks “Acceptable hotspots” setting - you then enter an additional “General limit, Rf” value below the Target value. The Pass/ Fail diagram then displays contours for three status levels of Pass, Warning and Failed for the calculated factor being; below the General limit, between this and the Target Rf and above the Target Rf respectively, as shown in the picture below.
-
VDV and Number of Events (per period) - the No. of Events results can be used as an alternative assessment when the Target Rf criteria cannot be met. This is termed a Variable Dose Value (VDV) assessment which allows for the temporary nature of the floor excitement. For greater ease of use, the guide’s calculation procedure is ‘inverted’ to provide a number of exciting events (e.g. an occupant walking along the walking path) likely to be required to produce an adverse response.
-
This number is calculated using the “Target vibration dose value (VDV)” the default for which is 0.2m/s1.75. The lower the calculated number of events for a given location (node of the floor slab 2D element mesh), the more likely the response there is to be adverse.
-
Refer to the SCI P354 guide Table 5.4 and Section 6.6 for further explanation of how the number of events is calculated and recommendations for the Target vibration dose value.
-
-
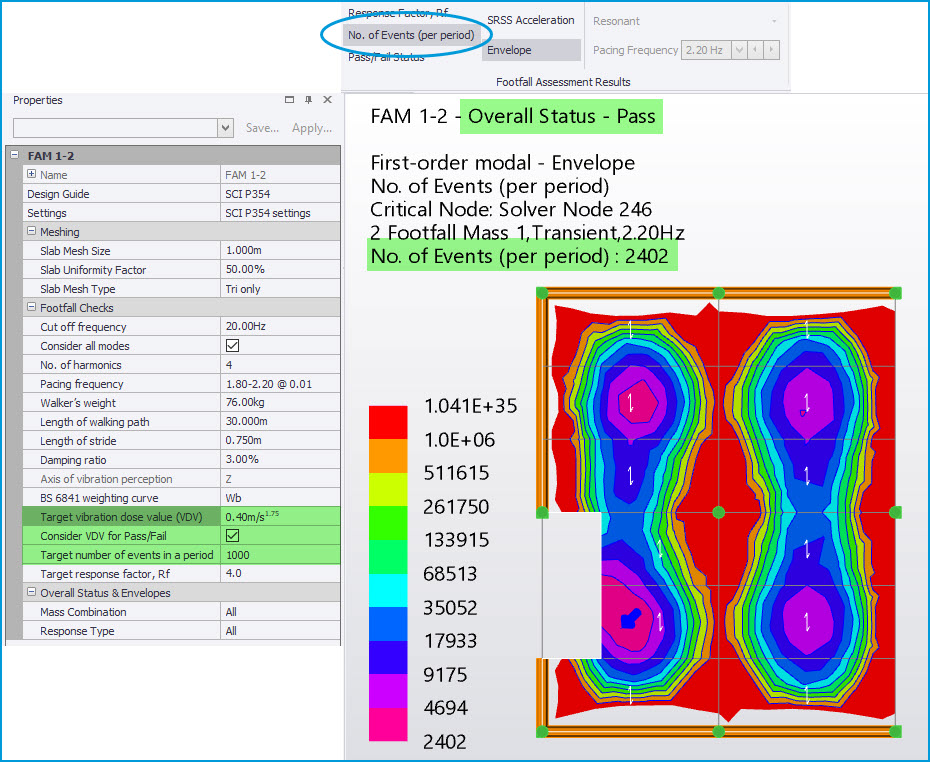
The No. of Events (per period) results are always calculated and can be viewed as a contour heat map by activating the Footfall Assessment Results “No. of Events (per period)” ribbon option. In the same manner as for Rf factors, you can view these results for an Envelope of all active Response Types and pacing frequencies, or specific selected Response Type plus pacing frequency.
-
These results are not actually used in the Pass/ Fail status assessment until the Footfall Checks > “Consider VDV for Pass/Fail” option is enabled. When this is enabled, the calculated number of event values are compared to the specified “Target number of events in a period” (which is typically agreed with the client). Any node values below this are accorded a Fail Status. Provided all calculated No. of Event values for the Envelope results are > the current FAM Target number of events value, an Overall Pass status is accorded - regardless of the Rf check results - as illustrated in the picture below.
-
-
SRSS Acceleration - finally, though they are not themselves a required assessment criteria, you can similarly view a heat map of calculated response (SRSS) acceleration values by activating the Footfall Assessment Results “SRSS Acceleration” option.
Reporting - various tables of Footfall Analysis results data are accessed via a dedicated Tabular Results view for a selected FAM model. A new “Footfall Analysis” chapter can also be included in reports.
-
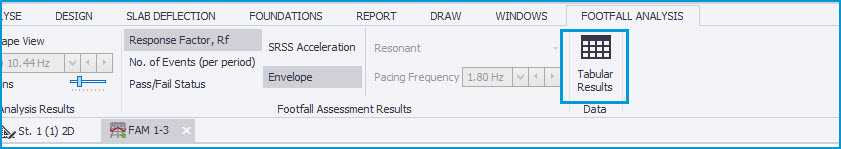
Tabular Data - with the Footfall Analysis View active, click the “Tabular Results” ribbon button to open the dedicated Footfall Analysis tabular results view where you can view various tables of the Footfall analysis and post-process calculation results. All of the tables can be exported to Excel from this view. As a rule, this data is not generally required for output but serves to make the calculation process transparent.
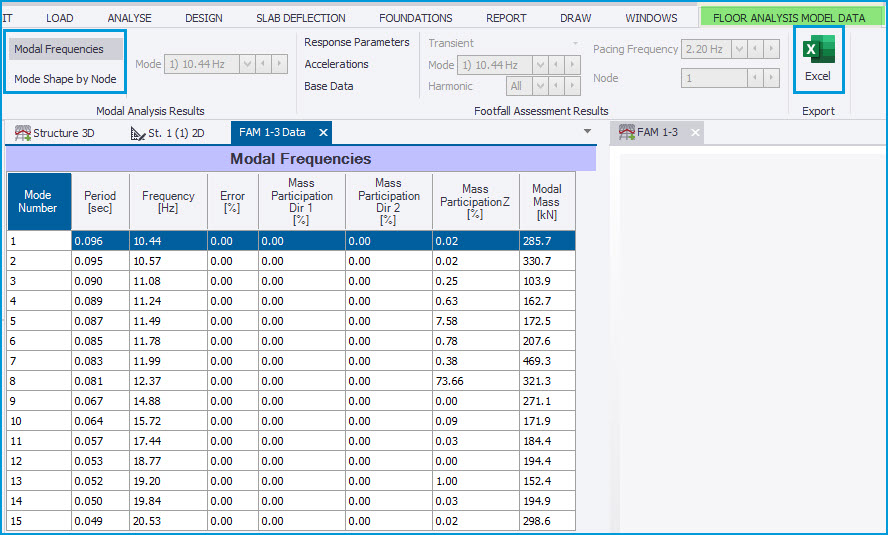
You can view tables of Modal Frequencies and Mode shapes (normalized to unity) as shown below.
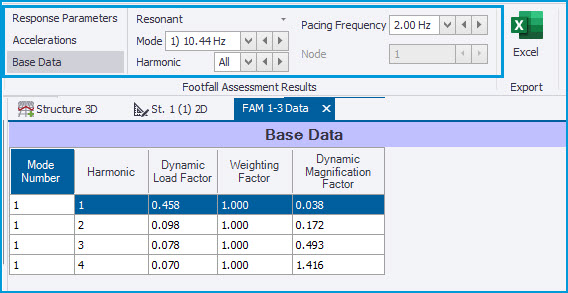
You can also view various Footfall Assessment Results tables; “Response Parameters” gives the calculated SRSS Accelerations, Rf and No. of events by node, while “Accelerations” and “Base Data” give intermediate values used in the calculation of these.
There are additional ribbon buttons to select the Response type, Mode and Pacing frequency and Node to view results for, depending on which result table you are viewing.
-
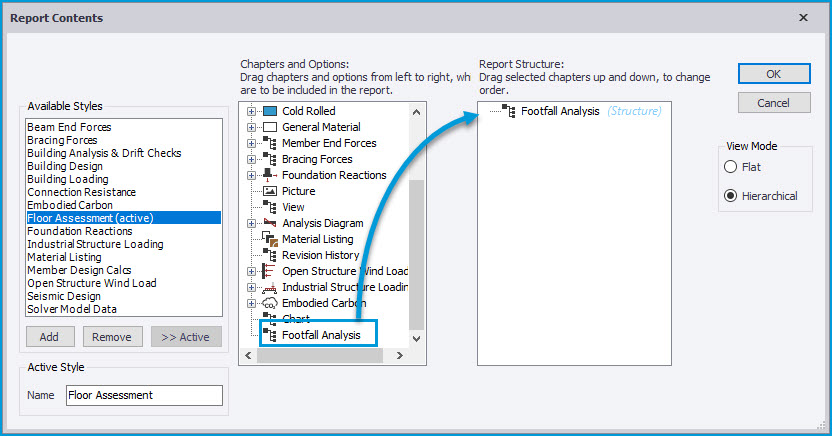
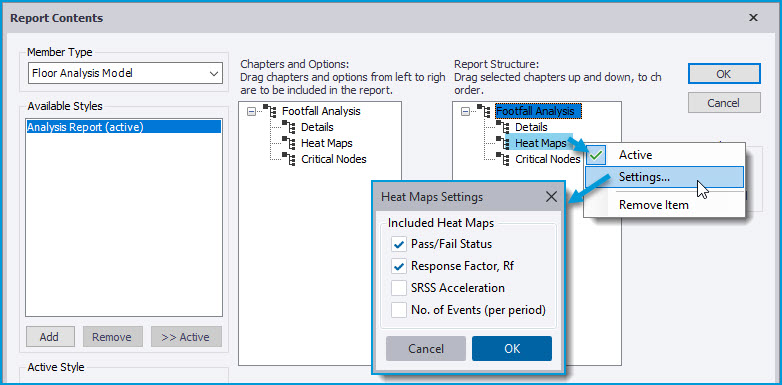
Reports - A new “Footfall Analysis” report chapter option is added to the list of available “Member” reports for the Member Type “Floor Analysis Model”, as shown in the picture below.
There are additional settings for the “Heat Maps” option to control which maps to include in the report - only those for the Rf and Pass/ Fail Status are included by default.
 The Report can be opened for a specific FAM via the context menu opened by right clicking with the cursor over a selected FAM in the 3D structure view, or any entity in a FAM view, and selecting the “Report FAM…” option.
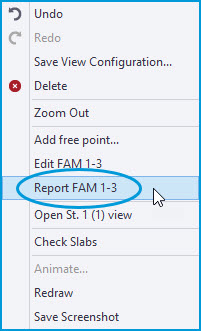
The automatically compiled report contains all the information you are likely to need to output for the Floor Assessment, as illustrated in pictures below; the Footfall Check settings, Rf and Pass/ Fail heatmaps and a table of key result and status at the critical nodes for the enveloped assessment results.
You can also create a Model Report of more than one FAM using the new “Footfall Analysis” model report chapter option, as shown below. By default this will include the reports of all FAM’s in the model - it can also be filtered by selected; levels, planes, sub structures and FAM’s.