How to make basic HTML-based excel reports
Not version-specific
Tekla Structures
Environment
Not environment-specific
To export reports to Microsoft Excel in a certain layout, for example, including merged cells, border lines, font types & sizes, you can use HTML in Template editor. This replaces the CSV file import in spreadsheets.
By using the extension type .xls.rpt in the name, the Excel report will automatically open in Excel when Show report is set to With associated viewer.
To begin export to Excel
To create an Excel template you can use the following steps. There is a template attached with the basic HTML tags, you can use this to copy the HTML tags to custom templates.
By using HTML you create a table that Excel can read. Every section of this support article will provide a certain layout feature of the tables.
By using HTML you create a table that Excel can read. Every section of this support article will provide a certain layout feature of the tables.
- Create a new .rpt template and save it as a .xls.rpt template.
- Create a Header and a Footer.
- Insert the following text fields in the Header:
<HTML xmlns:v="urn:schemas-microsoft-com:vml" xmlns:x="urn:schemas-microsoft-com:office:excel"><BODY><TABLE x:str >
- Insert the following text fields in the Footer:
</TABLE></BODY></HTML>
Note:We recommend that you put each text line in a separate text field.
Set column width
To start predefining the layout we recommend that you start by defining the widths of all the columns you want to use. If you don't set any column or row widths, Excel will use the default sizes.
In the Header, right under the
In the Header, right under the
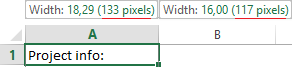
<TABLE x:str > tag, place the following tag:<COL style='width:"pixels"'> Copy this tag for the number of columns you want to show in the table.
For each column, set the width by changing
pixels to the pixel width in Excel.- The first
<COL style='width:"pixels"'>is related to column A - The second
<COL style='width:"pixels"'>is related to column B - Etc.
Example:
<COL style='width:"133"'>
<COL style='width:"117"'>
Image
Insert text and attributes in specific cells
To fill the cells of the table with text or value fields you have to use the following HMTL tags:
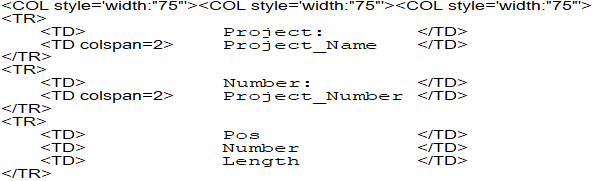
<TR>, <TD>, </TD> & </TR>.<TR>&</TR>are referring to the start and end of rows in the table.<TD>&</TD>are referring to the start and end of a cell in the row that the<TR> tagsare referring to.
Example:
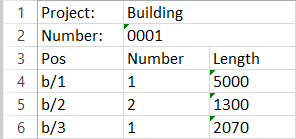
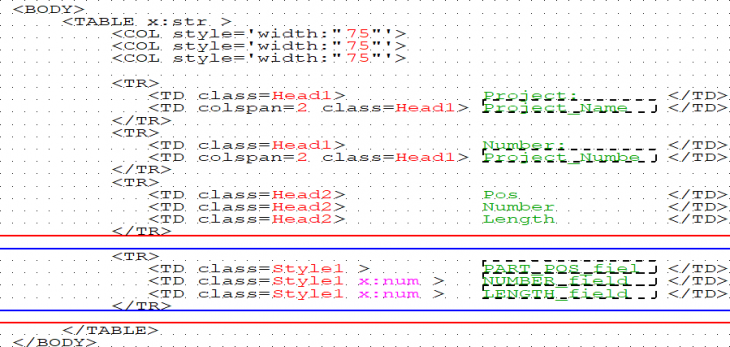
In the images below you see that the text "Project:" and the value "Project_Name" are below each other. But because they are both located between the first
<TR> & </TR> tags, they are both situated on row 1.The text "Project:" is in column A because this is set between the first
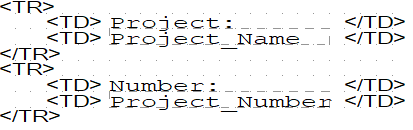
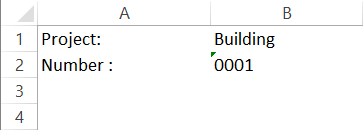
<TD> & </TD> tags, and the second <TD> & </TD> tags represent the second column (B), therefore it contains the value "Project_name" ("Building").
Image
Image
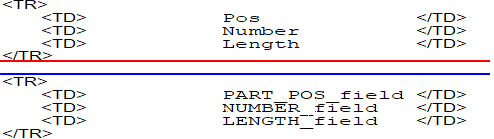
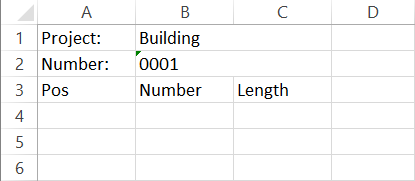
When you insert a row in the report you can simply make it visible in Excel by starting the row content with a <TR> tag and ending it with </TR>. This creates a row in the table for each part row in Template editor. In the example below, a part row contains the POS_number, Number, & Length value. The result is the output of 3 rows in the table with all the required values.
Image
Image
Not all the cells in a table have to be separate. To merge 2 cells in a row to one cell, use the
<TD colspan=N> tag instead of just the <TD> tag. You can change the "N" to the number of column cells you want to merge.Example:
By using
<TD colspan=2> for the cells that are containing the value field "Project_Name" & "Project_Number", cell B is now merged with cell C for both row 1 and 2.Image
Image
Tip: To merge row cells you can use
<TD rowspan=N>.Set custom font types, font color, borders, and fills
To predefine cell representation, such as font styles, font color, border lines, and cell fills, we need to add style blocks to the report. To insert style blocks, place the following text fields below the text field "
In the empty space between the
Step by step:
Example:
Between the
The top cells with the project information have the tag
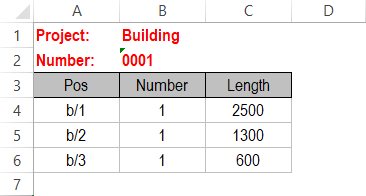
Here you can see the output in Excel. The rows 1 & 2 have style head1, row 3 has style Head2 and row 4, 5, & 6 have style Style1.
<HTML xmlns:v="urn:schemas-microsoft-com:vml" xmlns:x="urn:schemas-microsoft-com:office:excel">" and above text field "<BODY>".<HEAD><STYLE>- leave enough space ( ± 14 lines for each style you want to use)
</STYLE></HEAD>
In the empty space between the
<STYLE> & </STYLE> ags, add the style blocks. Each style block can contain attributes that refer to formattings like text alignment, font color, background color, border lines, etc. All the attributes that you don't set will get the default settings of Excel.Step by step:
- Give the style blocks names (Style1, 2, 3, Head1, 2, 3 or tpled1, 2, 3 )
- Place below the
<STYLE> taga text field ".stylename {" - After the open bracket "{" you can place an attribute that defines the cell content ( for example, the font family: Ariel Narrow; background:silver; text-align:center;
- When the attributes are defined, close the text field with a closing bracket "}"
- To use the styles that are defined in the style blocks, go to the
<TD> tagsof the specific cells you want to adjust. And add "class=StyleName" within the tag. For example,<TD class=Style1 >.
Example:
Image
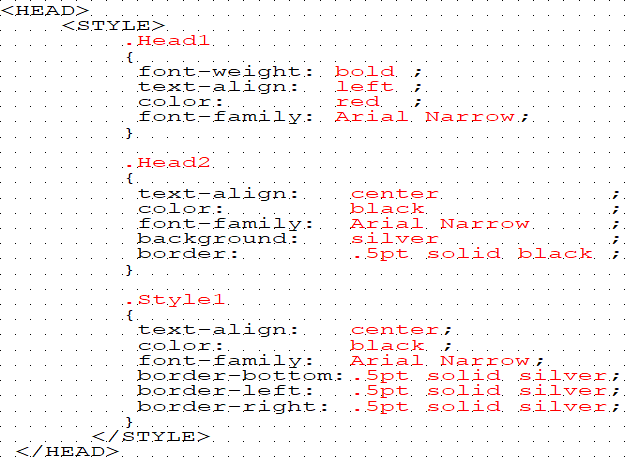
Between the
<HEAD> & </HEAD> tags you can see 3 styles: Head1, Head2, & Style1. Head 1 has an attribute font-weight: bolt; & color:red;, this will make the cell text red and bold. Head 2 has attribute background: silver; which makes the cell have a silver fill.Image
The top cells with the project information have the tag
<TD class=Head1>, which will give a red and bold text. All the cells in the part row have <TD class=Style1>, which will give the cell black text that is centered.Image
Here you can see the output in Excel. The rows 1 & 2 have style head1, row 3 has style Head2 and row 4, 5, & 6 have style Style1.
Additional tips
- To place an image in the Excel, place
<v:imagedatasrc="C:\<filepath>\image.png">within a <TD> cell. - Place
x:numwithin the<TD> tagwhen the output of the cell should be formatted as a number. - Use the Warehouse extension Reports Side Pane to avoid the corruption message when the Excel report is opened.